
In this article, we will cover:
- What Hotspots are
- Visualizing Hotspots
- Fire Grid: A Clear View of Wildfire Activity
- Satellites Used for Hotspot Detection
1. Hotspots
A hotspot is a thermal anomaly, often a heat source, that can indicate a potential fire.
Hotspots come from multi-spectral satellite data processed with specific algorithms that highlight areas with an unusually high temperature.
Each hotspot event has an associated location accuracy based on the satellite instrument’s pixel resolution.
This is visualized in the interface by a circle around the center of the hotspot. The accuracy (also known as GSD) is a property of the sensor (and for GEO satellites, additionally, the offset of the pixel location from the optical axis of the instrument).
In other words, Hotspots are detected using data from satellites that can sense heat. Each hotspot has a location accuracy, determined by the satellite's level of detail. Further on this article, we'll explore how the location accuracy is displayed per type of Satellite.
ℹ️ A hotspot is the smallest unit within what we refer to as Clusters. Essentially, it represents a detection made by one satellite.
Each hotspot has an own menu similar to Clusters containing related information, such as:
- Details: timely and practical overview of information on what triggered the detection:
- Acquisition Time: Time when the satellite captured and stored the image.
-
- Detection Time: Time when the thermal anomaly (hotspot) was processed*
- Weather at Acquisition Time: Weather conditions when the image is captured.
- Visible Images Available: Related visual imagery.
- Scientific Data: Information about the intensity of the heat source.
- LEO Satellite Passes: Low Earth Orbit satellite confirmations of the hotspot event.
*Beware of Acquisition and Detection Times. Refer to the FAQs for a more detailed description.
2. Differentiating Hotspots
Even though the core of information can be found in Clusters, it's important to understand how the detections differ from one another.
Simply put, hotspot detections can vary in 2 cases:
- Color - A hotspots color is directly associated to its age. The newer it is, the brighter it will be displayed. In this logic, older detections will be displayed in a grey tone.
- Size - Hotspots differentiate in size based on the type of satellite and resolution of the detecting instrument (also known as GSD). The rule is straightforward: smaller hotspots indicate greater accuracy.
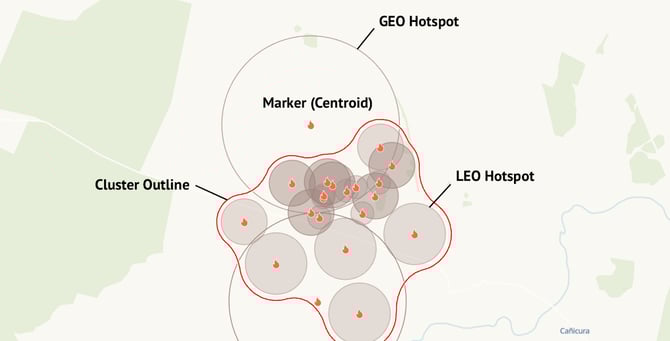
Image of a Cluster with several hotpots differing in size and colour.
In the image below, you can find a correlation between size and age of hotspots.
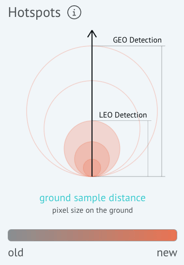
Hotspots are displayed as circles. Bigger circles are displayed as GEO detections, whereas the smaller ones are represented by LEO detections. This is directly related to GSD (pixel resolution and level of detail a satellite can capture).
3. Fire Grid
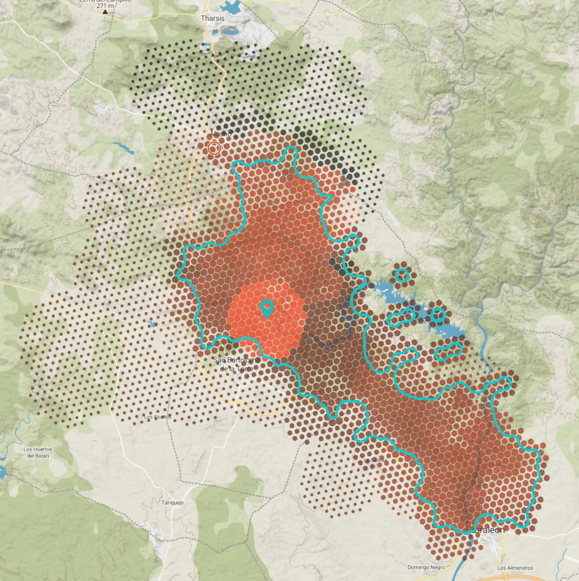
What is Fire Grid?
Fire Grid is an alternative visualization layer that aggregates hotspot detections into hexagonal cells.
It is designed to make wildfire activity easier to interpret during large and complex incidents where individual hotspots may overlap.
Fire Grid complements hotspots rather than replacing them.
Why use Fire Grid?
Use Fire Grid when you want to:
- Reduce visual clutter
- Understand fire progression
- Identify active fire fronts
- Monitor large incidents
- Improve map readability
Understanding Fire Grid
Cell Color
Cell color indicates how recently fire activity was detected.
- Bright yellow = most recent activity
- Darker colors = older activity
- Burned areas appear in the darkest colors
This allows users to quickly understand how a fire has evolved over time.
Cell Size
Cell size represents location certainty.
- Larger cells = higher location certainty
- Smaller cells = lower location certainty
This helps users understand both where fire activity is occurring and how confidently its location has been determined.
Interacting with Fire Grid
Hover over a cell to view:
- Detection time
- Maximum FRP
- Number of detections
- Satellite sources
- Associated cluster(s)
Clicking a cell automatically selects the related cluster and opens the cluster details panel.
4. Satellites Used for Hotspot Detection
Previously, it had been mentioned that the size of a hotspot is linked to its accuracy. This is directly related to the type of satellite used for detection.
We work with two types of satellites:
-
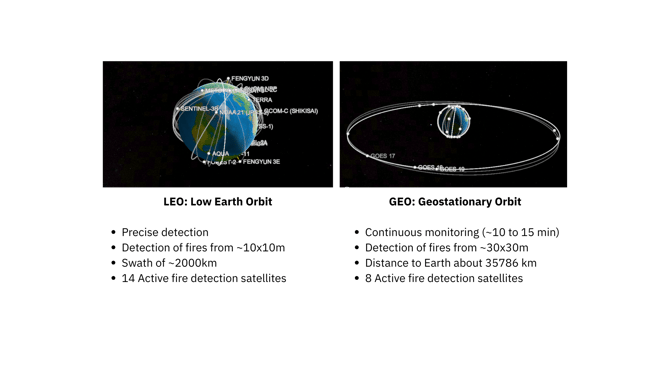
LEO satellites (Low Earth Orbit) orbit close to Earth's surface, typically at altitudes less than 1,000 km. Their proximity allows them to capture detailed observations with smaller ground footprints, making them effective for detecting small fires. However, they take longer to revisit the same location, usually several days.
-
GEO satellites (Geostationary Orbit) orbit at an altitude of 35,786 km above the equator, matching Earth's rotation. This makes them appear stationary over a fixed position. They can observe half of the Earth’s surface every 15-30 minutes but with much larger ground footprints, providing broader but less detailed coverage.
Comparison between LEO and GEO Satellites
Key takeaways:
- A single hotspot corresponds to one single satellite detection.
- Hotspots are the building block of clusters. A cluster can consist of multiple hotspots or just a single hotspot.
- A hotspots colour is not how intense the detection was, but rather, how old it is.
- LEO satellites provide more accurate data, with at least 20 single revisits per day for one specific location.
- GEO satellites offer 24/7 broad coverage, with new updates available every 10-20 minutes, ideal for large-scale monitoring but with less detail.