Welcome! If you've completed onboarding and read our Must-Read Intro Article, this is your next step. This article walks you through how to explore and use the platform with confidence.
1. Log In & Understand the Layout 🔐
When you first log in, the Wildfire Solution is divided into three key areas:
- 🧭 Menu bar (right) — access to main tools like Monitor, Layers, and Filters
- 🗺️ Interactive map (center) — where you see satellite detections and fire activity
- 📊 Incident Overview (bottom) — a table summarizing recent incidents in your monitored zones
💡 If you ever get stuck, the Help Menu (top-right) directs you back here to the Help Center!
2. Adjust the Timeframe ⏳
The map and incident data are time-sensitive. In the bottom right, use the Time Selector to:
- View data from the past 2 to 30 days
- Access historic detections (since Oct 2019)
- Watch how the overview and map change dynamically
![]()
3. What You See on the Map 🗺️
When you zoom in, detections become clearer:
🔥 Flame icons = Summary alerts from farther out
🟠 Circles = Hotspots (heat detections from satellites)
🔵 Blue outlines = Clusters (grouped hotspots indicating a potential incident)
📍 Hotspot = a single detection
🟦 Cluster = several hotspots grouped by time and space
4. Where Does the Data Come From? 🛰️
We detect fires using two satellite types: LEO (Low Earth Orbit) and GEO (Geostationary).
| Satellite | Strength | Limitation |
|---|---|---|
| GEO 🛰️ (Geostationary |
Fast detection (updates every 15 mins) | Less precise |
| LEO 🌍 (Low Earth ORbit) |
High-resolution data | Less frequent (due to orbit timing/cloud cover) |
On the map:
Dark red circles = LEO detections
Larger blurred circles = GEO detections
💡 We combine both LEO & GEO for speed and accuracy!
5. The Cluster Window (Diving into the incident) 🟦
Click on any cluster (or row in the Incident Overview) to open the Cluster Window.
The most important information you will find:
- First & last detection times
- Estimated affected area
- Weather conditions (past, present, future)
- Satellite overpasses (LEO/GEO)
- Burned areas (via Sentinel-2 imagery)
- Key metrics: these are metrics designed to provide certainty about whether a detected cluster could represent a fire.
-
-
Cluster Confidence (how many satellites agree)
-
1 satellite = low (e.g. 0.2)
-
3+ satellites = higher confidence
-
-
-
-
Fire Confidence (based on FRP, satellites, and weather)
-
FRP (fire intensity)
-
- Fire Spread: Predict fire movement using wind, terrain, fuel, and humidity.
💡 Hover over the properties & icons to get helpful tooltips!

6. Explore the Menu Bar 🗂️
Monitor
Set your own Monitored Areas & Alerts
-
Search by location: Type in a place name or paste coordinates
-
Draw or upload areas: Use your own shapefile or draw directly on the map
-
Set up alerts: Receive instant notifications (SMS, WhatsApp, email) when a fire is detected within your zone.
- Export data.
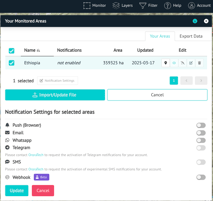
💡 Pro tip: Don’t forget to hit “Save” after setting your monitored areas!
Layers
Open the Layers tab to customize what you see on the map. Each layer gives you a different view of the situation on the ground.
-
Switch between base maps (💡 Bright layer helps spot hotspots clearly)
-
Add weather, wind, or lightning data
-
View power lines, land cover, and more
-
Activate satellite imagery like Sentinel-2
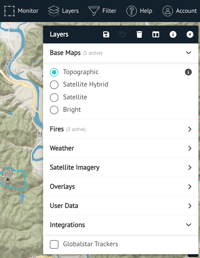
💡 Use this to tailor your map to your operational needs.
💡 Your own data (from cameras, towers, assets, resources) can be integrated into the WFS. You can learn more in the Custom User Data Integrations article.
Filter
Use Filter to refine what appears on your map and in the incident table.
Here you will find some of the elements we viewed:
-
Cluster Confidence (e.g. only show incidents with ≥ 0.2 confidence)
-
Satellite list — click "Satellites" to view and toggle which ones are active (LEO, GEO…)
💡 Great for focusing on just the most critical events or testing different data views.
Help
This is your fast track to support. You will find:
-
A link back to our Help Center
-
A Contact Us button — no need to open your inbox! It sends us an email directly.
Account
Click your profile icon (top right) to manage personal settings. You can adjust:
-
Language (English, French, Spanish, etc.)
-
Time zone and time format
-
Date display preferences
-
Profile info and password
💡 Make sure your time zone is correct to see detections and simulations in local time.
7. The Incident Overview 📊
At the bottom of your screen, the Incident Overview table gives you a live dashboard. You can:
-
Filter by confidence level, date, or severity
-
Sort to find the largest or most recent events
-
Customize columns
-
Identify Integrated Incidents (new feature!)
New: Integrated Incidents show if an event was detected:
Detected by OT onlyDetected by other sources only
Associated (detected by OT and another source)
✅ Your First Steps
-
Log in and go to the Monitor Tab
-
Add your area(s) of interest
-
Set up alerts (SMS, WhatsApp, Email)
-
Adjust the Layers tab to your needs
-
Click on a Cluster to explore detailed info
-
Use Incident Overview as your main dashboard
💬 Need help?
You're never alone on this journey. If something feels unclear or you want a walkthrough:
👉 Contact Support at support@ororatech.com or open the Help Center chat, we’ve got your back!