In this article, we'll cover:
1. Clusters
In a nutshell: Clusters are groups of hotspots that are close together in time and location. Each hotspot detection is a potential heat source detected by a satellite.
By grouping hotspots into clusters, we can track all relevant information without the need to check each hotspot data individually.
Similarly, as we discuss in our Understanding Hotspots section, Clusters can vary in size, forms, and outline. It helps visualizing critical information such as fire fronts and intensity, which are essential for effective fire suppression.
Next, we will share a short overview on clusters and how to analyze and interpret the available fire data.
2. Cluster Shape & Outline
Cluster Shape
The shape of a cluster, outlined in turquoise, offers an aerial perspective of the fire event. It includes all temporally and spatially correlated hotspots, helping track crucial information about active and historical wildfires, such as perimeters and worst-case affected areas.
Example of Fire Progression and Changes in Cluster Shape over time.

⚠️ Clusters do not necessarily indicate the exact area that is burning nor the area affected by the fire. Instead, they indicate that the fire can be somewhere within the outlined area, most likely where hotspots overlap.
Cluster Outline
Clusters are outlined according to type of satellite detection. It's important to differentiate them, in order to effectively read data in WFS.
The key takeaways are:- Clusters with only GEO hotspots will have a dotted outline.
- Clusters with at least one LEO hotspot will be fully outlined.
This differentiation helps clarify how the data is presented and interpreted.
To read more about the differences between LEO and GEO satellite detections, refer to this article.

3. Cluster Menu
As all hotspot data is collected and processed, clusters compile this information to deliver a comprehensive set of data.
The first submenu Details will display the most important information about the hotspots detected. It includes data about the first and last detections, coordinates, affected and burnt area, and metrics to determine the possibility of it being an actual fire.

It's important to highlight both Cluster and Fire Confidences, since they can support your decision making:
Cluster Confidence refers to the number of satellites and algorithms that have detected and processed the heat source. The higher the confidence, the more likely the cluster is an actual heat source.
Fire Confidence indicates how certain we are that a Cluster represents an actual fire. It considers weather data, the intensity of heat sources, the number of satellites detecting the heat source, algorithms, and the flammability of the land cover.
Timeline
The Timeline submenu enables effective fire management by displaying the latest Classifications submitted for a specific cluster.
Classifying events helps you track incidents, determine if clusters are genuine fires, identify the type of fire and cause, and manage responses.
To know more about why Classifications are important and useful for daily operations, refer to this article.
Weather Data
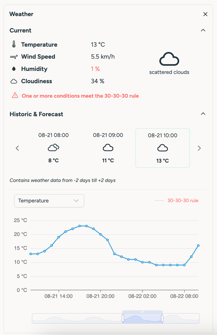
The third submenu on the list will display local weather information at the current moment you are visualizing the web app.
You can keep track of the local temperature, wind speed/direction, humidity, and nebulosity.
It is also possible to project historic and future Forecast from within a 5 day time window, provided also as overlays in Layers provided through OpenWeatherMap.
When weather conditions are extreme, we also apply the "30-30-30" rule, which reflects fire prone weather conditions (high temperature, low humidity, and strong dry wind).
LEO Satellite Passes
Since LEO Satellites are orbiting Earth they also require a certain minimum time to overpass a specific region on the globe. This means that each region in the world has specific time ranges that include LEO Satellite coverage. There are two main timeframes, one during daylight and one during the evening-night.
This section is crucial for determining when additional satellite information will be available.
To learn about when more data can be expected, refer to this article.
Fire Spread
The Fire Spread Model is a powerful tool that allows users to project a fire simulations for up to 24 hours. It accounts local topogrofy, fuel maps, humidity, wind speed and direction to predict how a fire might behave. This assessment can be integrated with other methods to enhance decision-making.
To learn how to use our fire spread model, please click here.
Hotspots Detected
Similarly to the LEO Satellites Pass, the Hotspots tab in a cluster shows a list of satellite overpasses. Note that this list only includes satellites that have made detections, while the LEO list provides a broader overview of all past and future satellites for the cluster.
🛰️ LEO Satellite Passes and Time Filters
LEO satellite passes can also be aligned with your selected time range using the default option “Match time filter.”
When enabled, the satellite pass list automatically follows the same timeframe as your map view and cluster analysis, making it easier to investigate both past and upcoming activity without changing contexts.
Users can still adjust the pass list independently when needed.
💡 This creates one consistent timeline across the platform for clearer fire analysis and easier interpretation of satellite activity.
This feature together with the Timeline feature explained in this article help you understand fire growth and intensity based on the Normalized Fire Radiative Power.

Incident Reports
Once you've analyzed a cluster and its hotspots, you can now generate a professional, customizable report with just a click.
The Incident Report is a downloadable PDF that summarizes the fire event — when and where it started, how it progressed, and what areas were affected. It's designed to help you communicate clearly and consistently across internal and external teams.
You can choose to include:
- Burned and affected area metrics
- Fire progression graphs
- Weather data and forecasts
- Land cover, confidence levels, and more
These reports are perfect for daily briefings, situation updates, or post-season reviews. They help reduce time spent compiling reports and ensure that everyone is aligned on the same facts.
💡 How to generate it:
- Open a Cluster
- Click Download
- Select Incident Report (PDF).
🔍 Find incidents faster with Cluster Search
Quickly locate specific incidents without manually browsing the map or incident list.
Use the global search bar to find clusters by name or ID. Results are organized into categories such as Incidents, Subareas, Locations, and Coordinates, helping you quickly narrow down your search.
💡 This is especially useful when working with multiple incidents or when referencing a specific cluster ID during operations.
Summary
This way, Clusters simplify fire tracking, helping you quickly see where fires are active and the areas they impact.
Additional data can also be found in Clusters, such as Burnt Areas, Affected Area, Fire Radiative Power (FRP), and local Land Cover - which we'll cover in later sections.