
Go beyond individual fire detections and get a clearer picture of wildfire activity.
Use WFS's different map visualizations to locate incidents, explore their estimated extent, and identify patterns across larger areas. Compare cluster perimeters, explore cumulative fire extent, and choose the view that best supports your analysis.
Default Cluster
The Default Cluster Perimeter outlines a cluster based on satellite hotspot detections associated with the same fire event.
Displayed as a turquoise outline on the map, the cluster shape includes detections correlated in time and location. As additional detections become available, the shape can change, helping you follow the development of detected fire activity.
How to interpret the outline
WFS distinguishes cluster outlines based on the satellite detections they contain:
- Dotted outline: The cluster contains only GEO satellite detections.
- Solid outline: The cluster contains at least one LEO satellite detection.
These outline styles help you recognize the types of satellite observations contributing to the cluster.
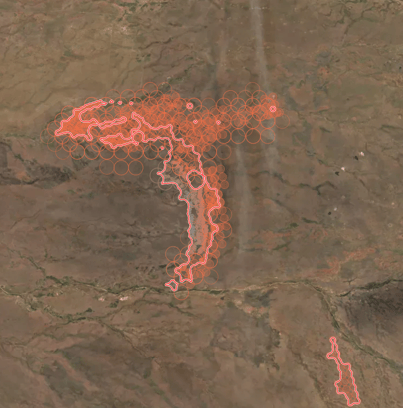
⚠️ A cluster perimeter does not necessarily represent the exact area currently burning or the confirmed area affected by a fire. It indicates an estimated area where fire activity may be occurring, based on available hotspot detections.
Weighted Cluster Perimeter: A more refined view of fire extent
Not all satellite detections have the same level of location certainty.
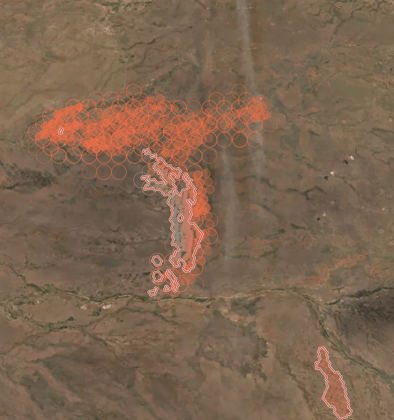
The Weighted Cluster Perimeter (Beta) takes this into account when calculating a cluster's shape, giving greater influence to detections with more reliable location information.
This provides an alternative, more refined representation of the fire's estimated extent.
You can switch between the Default Perimeter and the Weighted Cluster Perimeter to compare the 2 visualizations.
How to access it:
- Open Layers.
- Navigate to Weighted Cluster Perimeters.
- Enable the layer to explore the weighted perimeter visualization.
When to use it: When you want to examine an individual fire's estimated extent in greater detail or compare different perimeter representations.
Lifetime Cluster Perimeters (Beta): See the bigger picture
What if you want to understand wildfire activity across an entire region, rather than looking at incidents individually?
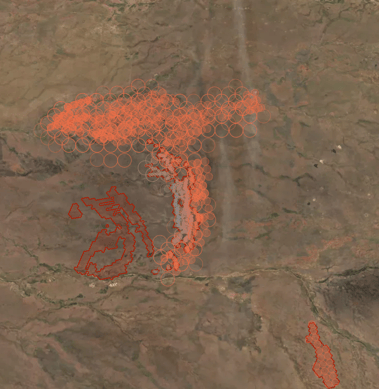
The Lifetime Cluster Perimeters (Beta) visualization shows the cumulative fire extent of multiple incidents across your area of interest within a selected timeframe.
By combining satellite detections and accounting for their location certainty, this layer provides a broader view of affected areas and wildfire activity.
Instead of examining one cluster at a time, you can explore the cumulative spatial extent of multiple fires in a single map view.
How to access it:
- Open Layers.
- Navigate to Lifetime Cluster Perimeters.
- Enable the layer and select the timeframe you want to explore.
When to use it: When assessing wildfire activity across a larger area, reviewing cumulative affected areas, or understanding regional wildfire impacts.
Fire Grid: Make sense of large numbers of detections
When many satellite fire detections appear close together, the map can become difficult to interpret.
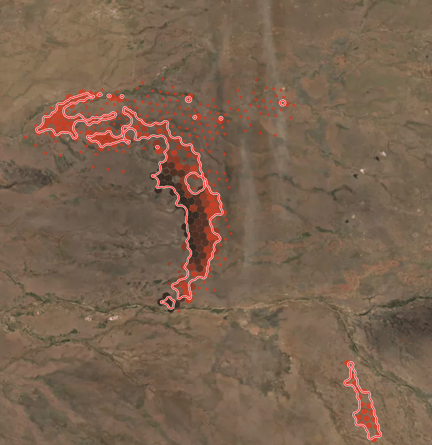
Fire Grid provides another way to explore wildfire activity by organizing detections into a scalable grid visualization. Instead of displaying every detection individually, it helps you identify where fire activity is concentrated and recognize broader spatial patterns. Unlike cluster perimeters, Fire Grid focuses on the distribution of satellite detections, rather than outlining the estimated extent of an individual incident.
When to use it: When exploring areas with dense fire detection activity or looking for broader patterns without overwhelming the map.
🔎 Which fire visualization should I use?
Each visualization answers a different question. Use this quick guide to choose the view that best supports your analysis.
|
If you want to… |
Use… |
|
View the estimated extent of a fire |
Default Cluster Perimeter |
|
Compare a perimeter that accounts for detection location certainty |
Weighted Cluster Perimeter (Beta) |
|
Assess cumulative fire extent across multiple incidents |
Lifetime Cluster Perimeters (Beta) |
|
Identify patterns in areas with many fire detections |
Fire Grid |
💡 Tip: Start with the cluster location to identify an incident, then explore its perimeter for a closer look at fire extent. For a broader regional assessment, switch to Lifetime Cluster Perimeters to see cumulative wildfire activity across multiple incidents.
🛰️ Understanding satellite-derived fire perimeters
WFS fire perimeters are calculated from satellite fire detections. They provide valuable spatial context, but it's important to understand what they represent.
- Estimated extent: A calculated perimeter is not necessarily the same as a ground-verified fire boundary or confirmed burned area.
- Satellite location certainty: Some detections have more precise location information than others. Weighted perimeter visualizations account for these differences.
- Available detections: The resulting visualization depends on the satellite detections available for the area and timeframe being analyzed.
For operational decisions, consider these visualizations alongside other available information and verified local observations.
🌍 From individual incidents to the bigger picture
There is no single visualization that answers every wildfire monitoring question.
Cluster locations help you identify incidents. Cluster perimeters help you explore their estimated extent. Weighted perimeters provide an alternative representation that accounts for satellite detection location certainty. Lifetime perimeters extend the view across multiple incidents, while Fire Grid helps reveal patterns in dense detection data.
By choosing the visualization that matches your task, you can turn satellite fire detections into a clearer understanding of wildfire activity—from a single incident to an entire region.